- 51Aspx源码必读 .txt[2KB]
- from.gif[4KB]
- jQuery.Plotter.v1.4.sln[2KB]
- jQuery.Plotter.v1.4.suo[42KB]
- 最新Asp.Net源码下载.url[123B]
源码介绍
源码参数
源码描述
现在网络上有大量的Javascript图表类库。
本源码在演示如何整合Javascript图表类库在ASP.NET(Adam.JSGenerator),如何建立客户图表取决于您的需要。
已经修正之前版本中出现的问题。
This version aims to show the power of the dygraphs library that I used in the version 1.3 of ASP .NET Plotter.
In this version, I used dense data sets, date time for X coordinates, added rolling periods support and custom bars.
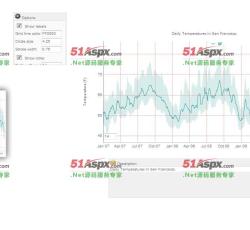
Let's have a look at this chart generated by ASP .NET Plotter.
To navigate in the chart, download the source code of this version, click on the fourth thumbnail, mouse over to highlight individual values.
Click and drag to zoom. Double-click to zoom back out. Change the number and hit enter to adjust the averaging period.
Sometimes your data has asymetric uncertainty or you want to specify something else with the error bars around a point.
This plot illustrates this. The point is the daily average and the bars denote the low and high temperatures for the day.
下载记录(Only Recent 100)
| 用户名 | 推荐指数 | 下载时间 |
|---|


